Improving workflow efficiency for creating nitrogen prescriptions
What
Redesign of nitrogen Rx tool for Granular Agronomy
Who
I worked closely with a Product Manager, Engineering Lead, and Data Scientist.
When
2019 - 2020 (launched Oct 2020)
Because crop fields are not uniform, farmers use variable rate nitrogen prescriptions to apply different amounts of nitrogen (a type of nutrient) to different areas of the field. A prescription is a map that shows how much nitrogen should be applied to each “zone”. The map is created using special software, typically by an agronomist (aka “crop doctor”). Farmers use prescriptions by loading the maps into their tractors and using GPS equipment to apply the right amount of fertilizer to each zone.
The challenge
During my time at Granular, we acquired a legacy nitrogen product and proprietary science model that generates prescriptions based on soil classifications, historical yield, and weather data. In late 2019, I was tasked with designing a nitrogen prescription tool for the new Granular Agronomy platform that uses this science model. This new tool offered a more intuitive interface and improved actions, ultimately helping agronomists better serve customers.

Nitrogen feature in the legacy product

Redesigned page on new Granular platform
This was a unique opportunity to build a new product from almost scratch while applying learnings from a similar tool in the legacy product.
Note: Since I’ve left the company, Granular Agronomy and this feature has been incorporated into another product line.
How do agronomists think about nitrogen?
To better understand our users and their needs, I conducted interviews with farmers and agronomists, chatted with customer support reps, and reviewed previously collected feedback from legacy product users.
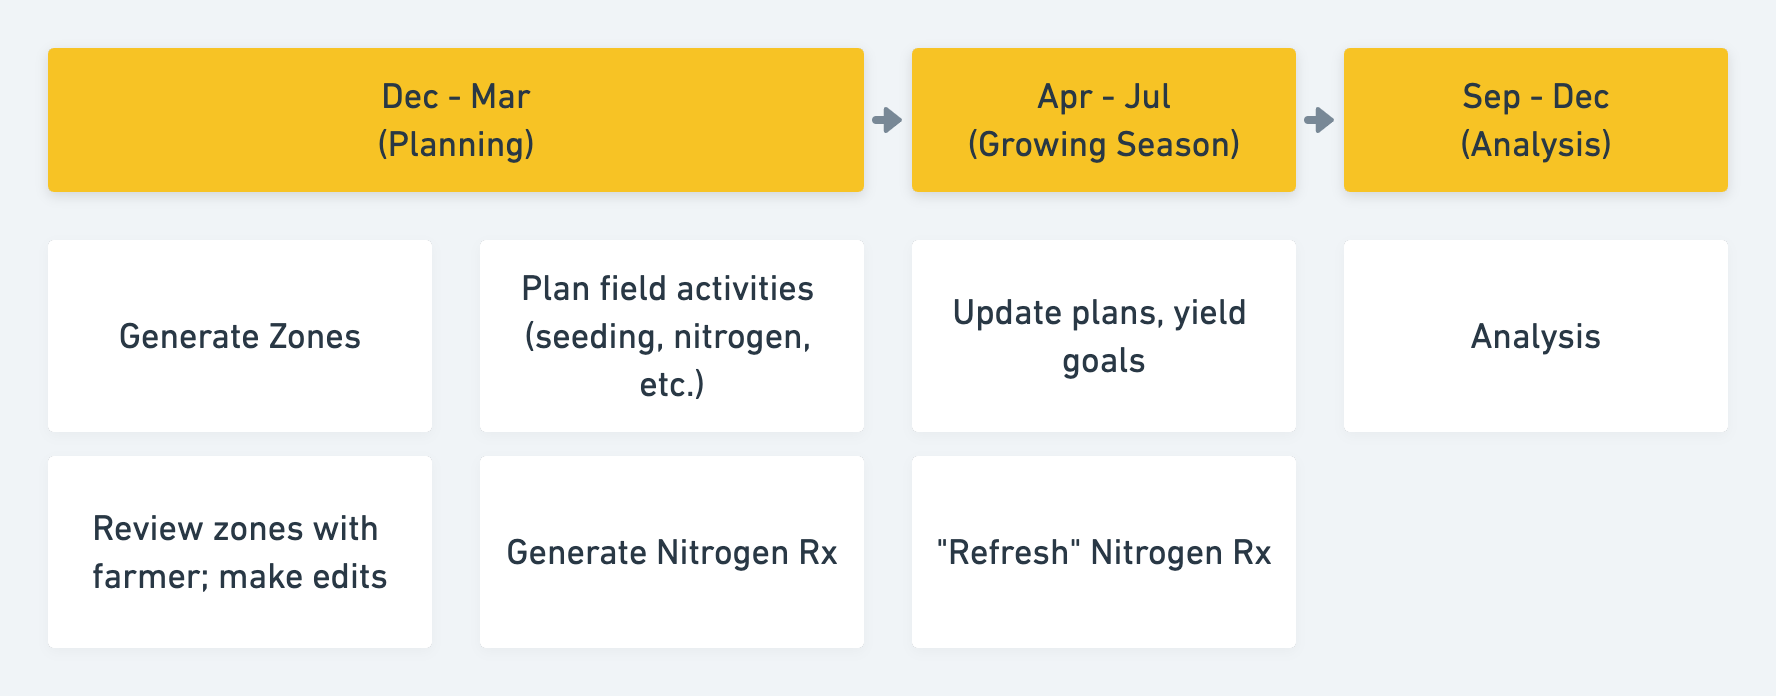
My product manager and I focused the scope of this project on the "planning" part of the year, when agronomists prepare for the upcoming year and create nitrogen prescriptions. This is the time of year when agronomists spend the most time using software as opposed to being out in the field, so we wanted to ensure that our tool would be particularly helpful to them during this busy period.
To kickstart this project, I facilitated a workshop with our team of designers, PM, engineers, and data scientists. We presented our research findings to the team and did a collaborative exercise using Object Oriented UX principles.
The goal was to align the team on our users and their needs, define concepts that mimic the mental model of our users, and establish a shared language for better team communication.
Defining the problem
According to our data scientist, the science model requires a lot of user-entered data in order to work, such as:
“Seed plans” (when and what type of seed you intend to plant)
“Nitrogen plans” (when and what type of nitrogen fertilizer you intend to apply)
Average yield goal
The main design challenge I faced was: How can we make it easy for agronomists to enter information about each field in order to generate nitrogen prescriptions? My goal was to find a solution that streamlines data entry required to generate nitrogen prescriptions.
Initial design explorations
After reaching alignment with the team on the general concepts that the science model would require to work (such as “field”, “zone”, and “seed plan”), I explored divergent ideas for workflows that started from no data and ended with nitrogen prescriptions for each field on a farm.

I explored a LOT of different layouts and workflows, from wizard setups to kanban boards to timelines. Here is just a sample!
Incorporating user feedback
We sought continuous feedback from customers to inform design decisions and build confidence on direction. Here were some key insights we learned from testing initial concepts:
For logistical reasons, farmers tend to use the same "seed plan" and "nitrogen plan" on multiple fields. As a result, agronomists tend to enter seed plans for all fields, followed by nitrogen plans.
This insight led us to prioritize a solution that allows users to apply plans to multiple fields at once, rather than a field-by-field approach.
Agronomists appreciate smart defaults, but prefer to have more options and control. They consider themselves to be "advanced users" who want more flexibility.
Agronomists aren’t particularly interested in “scenario planning”, or testing different nitrogen plans against each other. The farmer actually does this planning, so the agronomist simply wants to enter the agreed-upon plan after the farmer has made their decision.
Using these learnings as a guide, we eliminated some of our less promising ideas and focused on concepts that would better meet the needs and preferences of our agronomist users.
One concept we were initially excited about was a wizard that guides users through entering necessary field information to generate a nitrogen prescription. However, during user testing, we learned that the various information gets entered at different times of the year, and agronomists don’t want to do everything at once, so I had to consider a another approach.
Final designs
Users told us that fields often have the same nitrogen plans, and unexpected changes to those plans throughout the growing season (for example, a large rainfall) typically impacts many fields.
As a result, the final designs prioritized 1) sorting and filtering of fields and events to select items to take action on, and 2) easy bulk actions across fields and events such as updating the yield goal or changing application date.
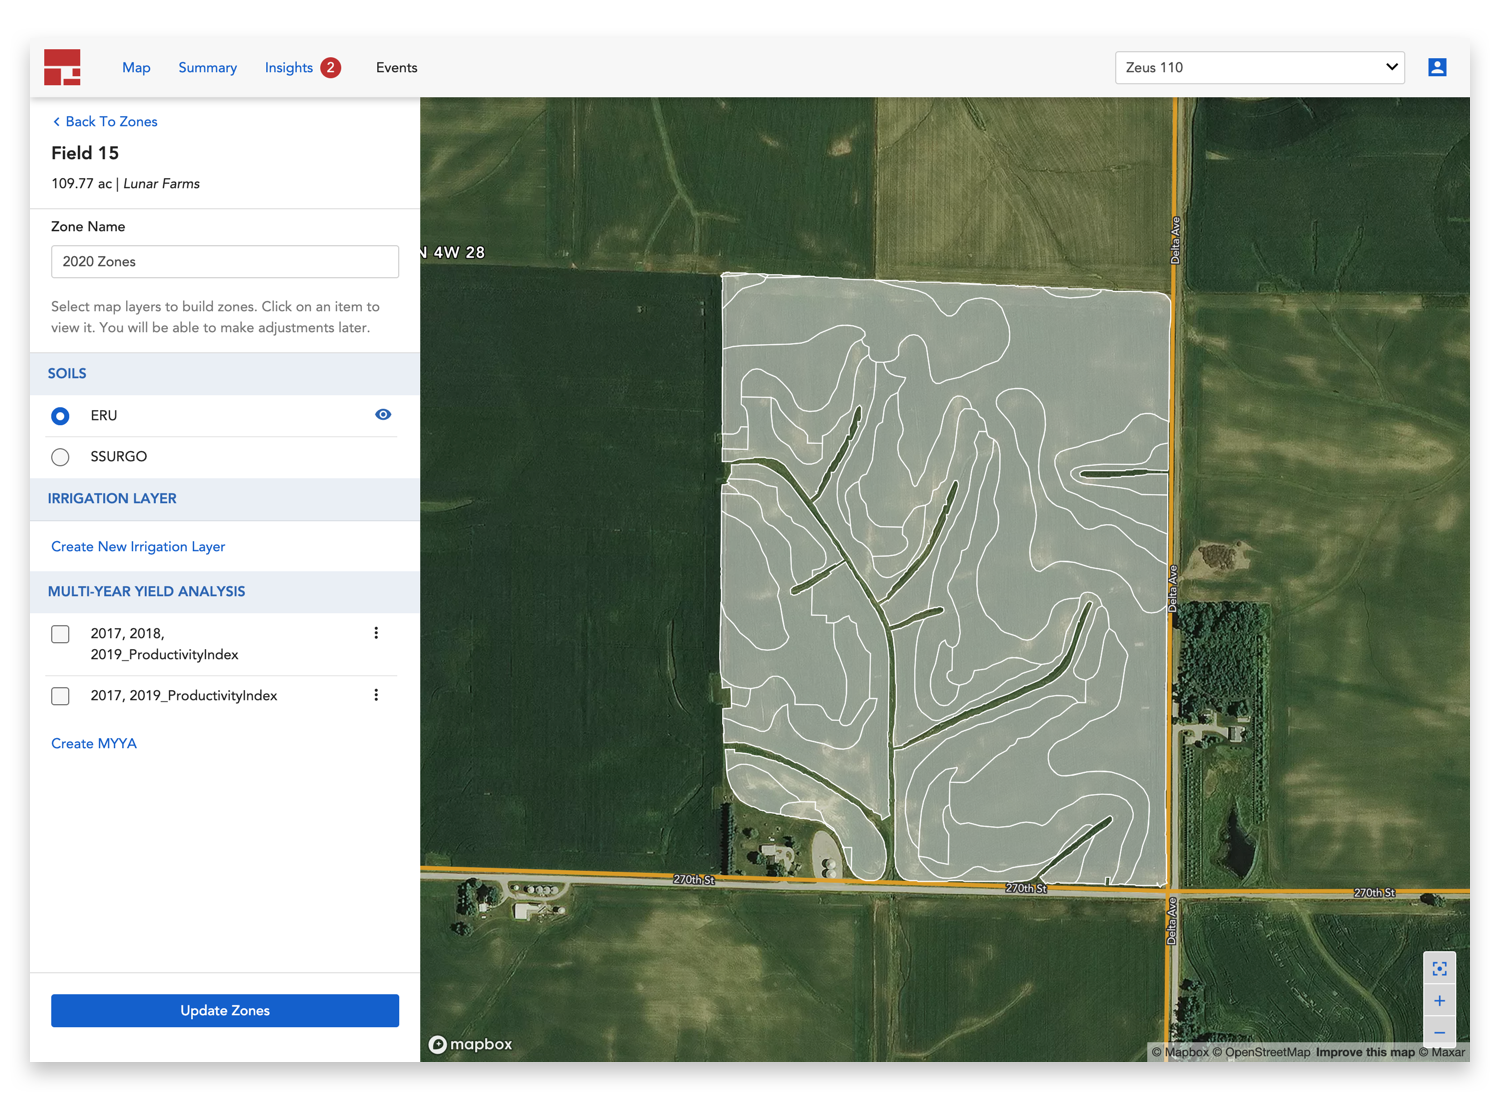
Management Zones
Before creating plans and generating prescriptions, agronomists must first set up management zones on each field. A customer we talked to described zones as "the foundation to everything you do".
I designed a workflow that lets users create zones and view them against different map layers such as soil type, historical yield, and irrigated areas.
Field View with Event cards
On this page, users can see a list of all fields, sort or filter by data such as planting date, and perform bulk actions to these fields such as adding events or updating yield goal.
Users also want to see events on each field. While fields appear as rows in a table, to avoid a table-within-a-table situation, I represented each event as a card.
Each event card has an icon that represents the event type (nitrogen, seeding, etc.) so that users can quickly understand planned activities on each field at a glance.

Application view
Farmers typically do the same seed or fertilizer applications on multiple fields. We built Application View to allow users to sort or filter by application date, product name, or product rate to perform bulk edits to events.
This comes in handy in many situations. For example, after a big rainfall that delayed planting, the user may want to filter by all applications that were supposed to occur on a certain day, select all, and change the planned date to the following week.
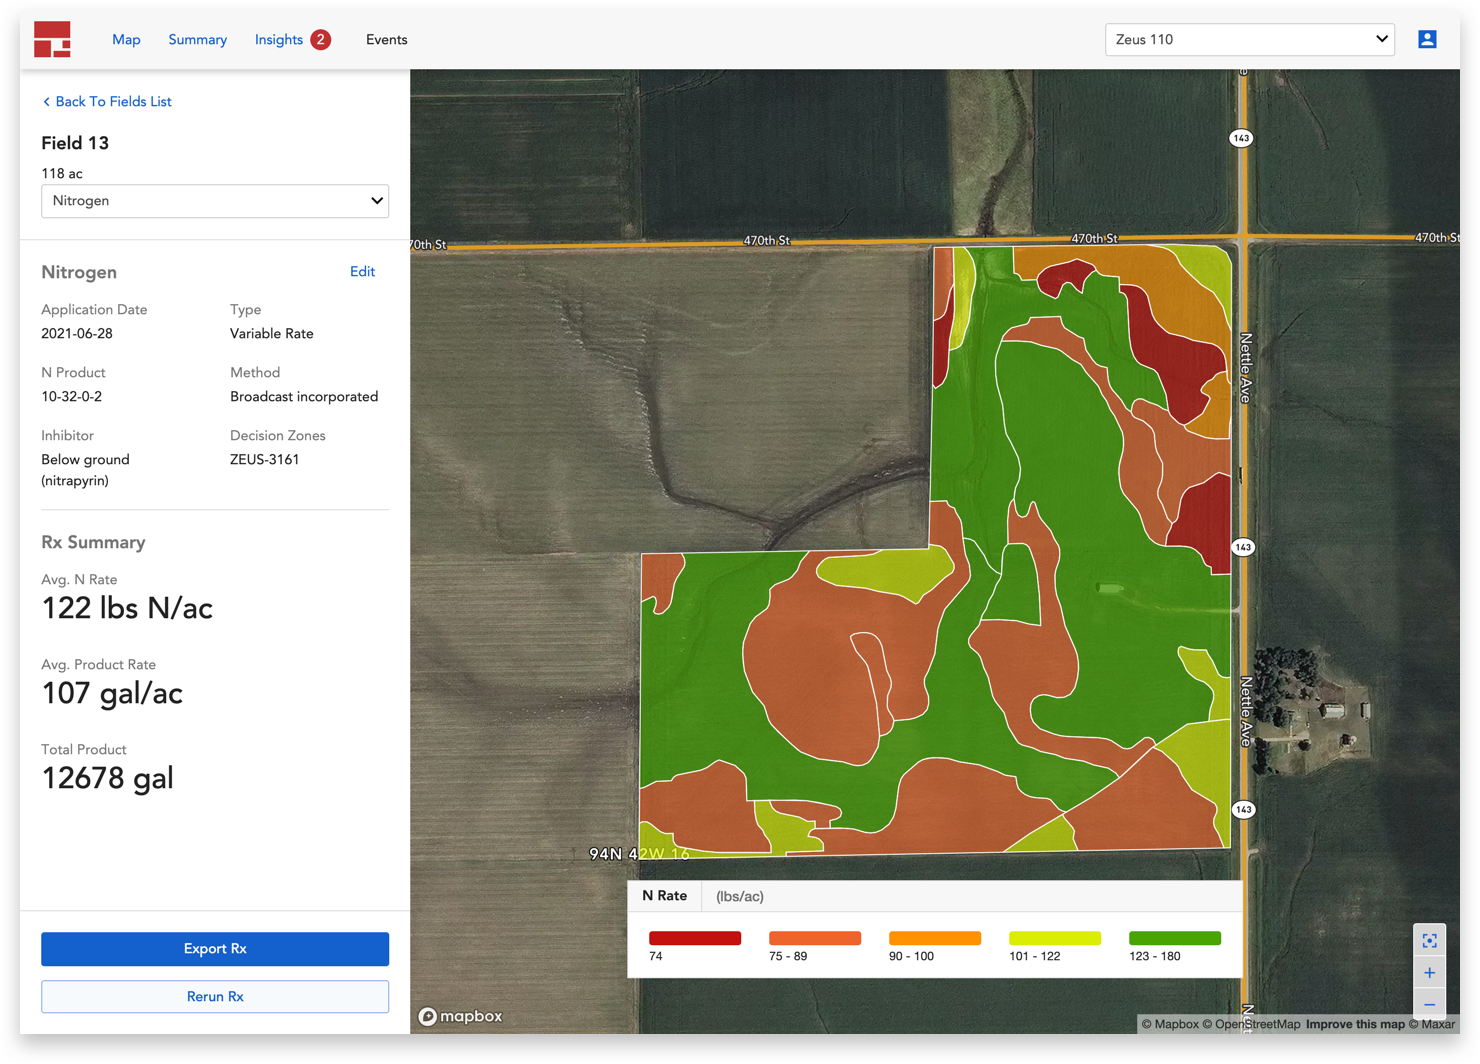
Nitrogen Rx details
When nitrogen events are created on fields with zones, a nitrogen prescription is created. Users can click into a Nitrogen Event to see the map view of the prescription and more details.
Development & Results
I worked closely with our engineering team throughout the development process to build out these designs using Granular Design System components.
Granular Agronomy + Nitrogen was launched in October 2020, ahead of the 2021 spring planting season. Throughout 2020, we ran a beta program with a group of users to solicit feedback and catch bugs, then a demo period to help users adjust to the new platform. Here’s some of the feedback we have received:
“This is way faster and more efficient than it used to be. This process is way simpler. You have to dig for stuff in the old product.”
“I think there’s a big step here... just that I don’t have to build a plan, then apply it, then run it; and not waiting on simulations. That right there is a boost in my productivity and efficiency.”
Finally, here are some improvements in task efficiency comparing our new designs to the heritage product:
Legacy Product
Not possible (users had to create zones in a separate desktop app, then export to legacy product)
Our Redesign
30 seconds (75% faster compared to desktop app)
Legacy Product
30 seconds per field
Our Redesign
12 seconds to do in bulk (60% faster)
Legacy Product
60 seconds per event
Our Redesign
20 seconds to do in bulk (66% faster)