Granular Business
Consolidating nutrient workflows for potato farmers.
Granular Business is farm management platform that helps farmers remain profitable by capturing field activity. Applying fertilizers to crops is an essential part of a farm’s work. In 2019, I designed Nutrient Plans by consolidating fragmented workflows into a unified planning and tracking tool to help farmers with fertilizer cost analysis, a critical step in unlocking the $13M specialty crop market.
Note: Since I've left Granular, the Granular Business product line has been acquired by a different company.
Role
Product Designer
Team
1 product manager
3 engineers
TIMELINE
2019
The opportunity
Moving beyond commodity crops to specialty agriculture.
Specialty row crops include potatoes and sugar beets. For this project, we were specifically interested in building for potato growers.
Granular had built a strong farm management platform for commodity crops like corn and soybeans, but the potato market represented a significant expansion opportunity: $13M in potential revenue, with farms earning $3-4K per acre.
Through early research, our team learned that potato farming requires more intensive nutrient tracking than commodity crops—more frequent fertilizer applications, tighter monitoring of nitrogen-phosphorus-potassium (NPK) ratios, and detailed record-keeping for food safety compliance.
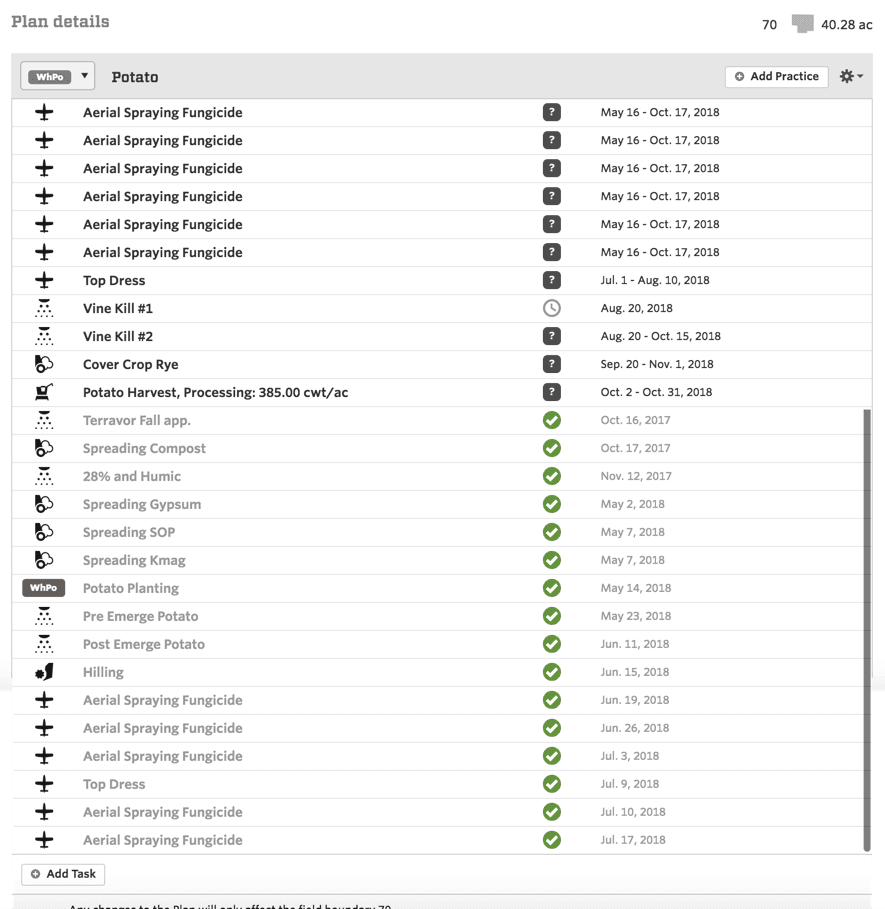
A field plan on a potato field shows numerous applications of fertilizers and chemicals throughout the crop cycle.
Our existing platform could track that a farmer applied fertilizer on a given date, but it didn't show the actual nutrients (N-P-K breakdown) from those applications. This forced farmers to manually calculate nutrient totals in spreadsheets while maintaining activity tracking in Granular — a duplication of efforts that was painful for all users, but especially for those who grow heavily managed crops such as potatoes.
🥔 My challenge: design a tool that consolidated these workflows and made Granular indispensable for potato farmers.
Discovery research
Solving a math headache.

This Wisconsin farmer was maintaining nutrient records… in Microsoft Word??? 😫
To better understand the needs of our customers, I toured potato farms, examined current solutions, and reviewed competitors in the industry.
What I learned:
🧐 The math is more complex than it looks. Fertilizer products are labeled with NPK ratios (like 28-0-0 ), but farmers need to calculate actual nutrient amounts. For example: if you apply 130 pounds per acre of Anhydrous Ammonia (82-0-0), you're actually applying 106.6 pounds of nitrogen (130 × 0.82). This seems straightforward until you factor in:
Multiple products with different NPK ratios
Multiple applications throughout the season
Conversions between volume and weight
Accumulation across all applications
Farmers were doing these calculations manually in spreadsheets, then re-entering application data into Granular. This duplication was tedious and error-prone.
🎯 Farmers don't just track nutrients retrospectively—they plan forward from targets. Potato farmers know they need roughly X pounds of nitrogen per acre to hit their yield goals. They work backward from that target, planning which products to apply and when.
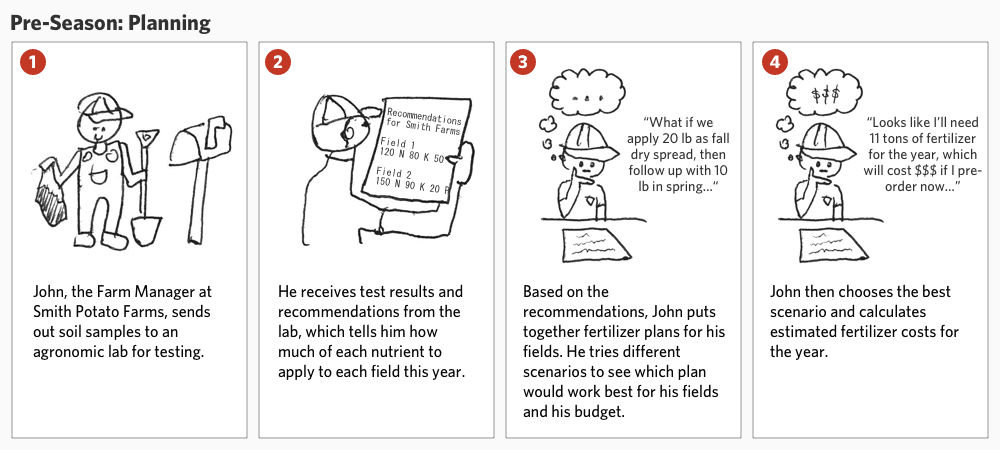

I created storyboards to illustrate the differing needs between pre-season planning and in-season tracking.
Key Decision 01
A new home for nutrient management.
The question: Should nutrient management be added to existing workflows, or as a dedicated surface?
What I explored: Currently, pre-season planning and in-season activity tracking are handled by different surfaces in Granular Business. I considered adding NPK amounts to existing pages, but they weren't the right fit to house all the nutrient management features we wanted to add in the future.

Crop Plans: (Concept/wireframe) During pre-season, farmers use this page to plan field activities for the year.

Field Plans: Farmers apply crop plans to fields, then come here during the growing season to check on actual and planned field activities.
What I decided: Create a new, dedicated page for nutrient management, separate from existing workflows.
Why it mattered: Unlike Crop Plans (primarily pre-season) or Field Plans (primarily in-season), a unified management page could serve both planning and tracking needs throughout the entire crop cycle. Most importantly, user testing revealed that growers were interested in scenario modeling — the ability to quickly switch out fertilizer products or amounts applied to see how it may affect their bottom line. Existing pages weren't set up well to accommodate this.
In addition, a new page could evolve into a comprehensive nutrient hub, incorporating post-season analysis and multi-year insights (out of scope for this initial launch).
The main tradeoff — adding another page to the navigation — was acceptable because nutrient management represented a fundamentally different workflow that warranted dedicated space and room to grow.
Key Decision 02
Balancing different user needs throughout the year.
Our research revealed two distinct workflows with different needs:
Pre-season: Strategic planning, entering targets, scenario modeling, cost estimation
In-season: Monitoring nutrient accumulation, tracking remaining needs, adjusting plans based on field conditions
This presented a unique design challenge in agricultural software: how do we create a unified surface that remains relevant and useful throughout the entire crop year?
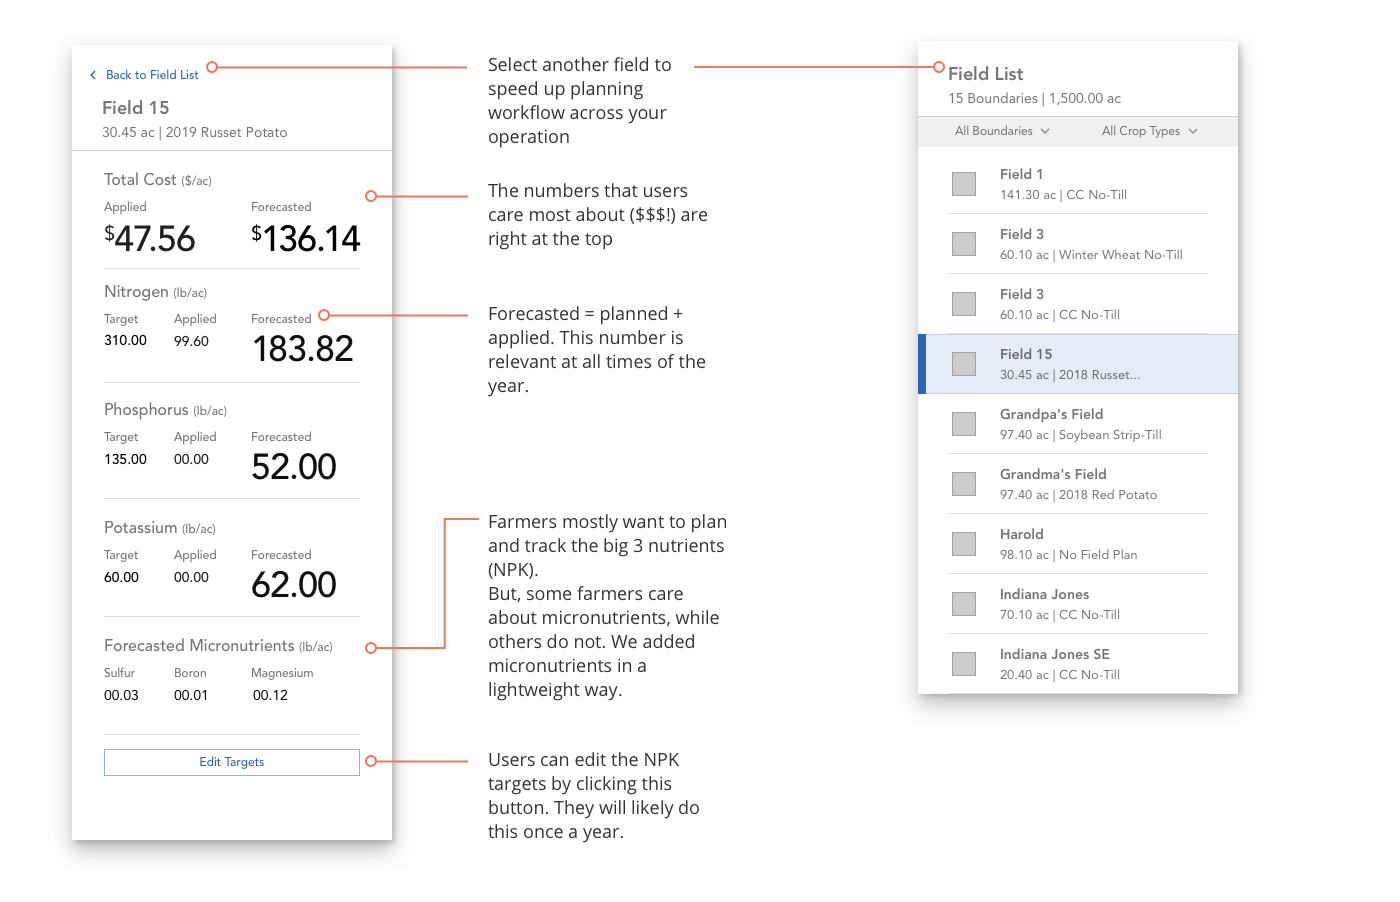
With four roll-up values to display (Target, Forecasted, Planned, Actual), I explored several layouts and tested them with growers.

Version A: Nutrient targets placed at the top since entering targets is the first step in nutrient planning. Actual and forecasted amounts appear in a bottom action bar, visible before saving changes to the field plan.

Version B: Nutrient targets moved to the bottom alongside forecasted, actual, and planned amounts in a table format. This consolidated all values in one location, but required users to scroll to the bottom to see these important summary figures.
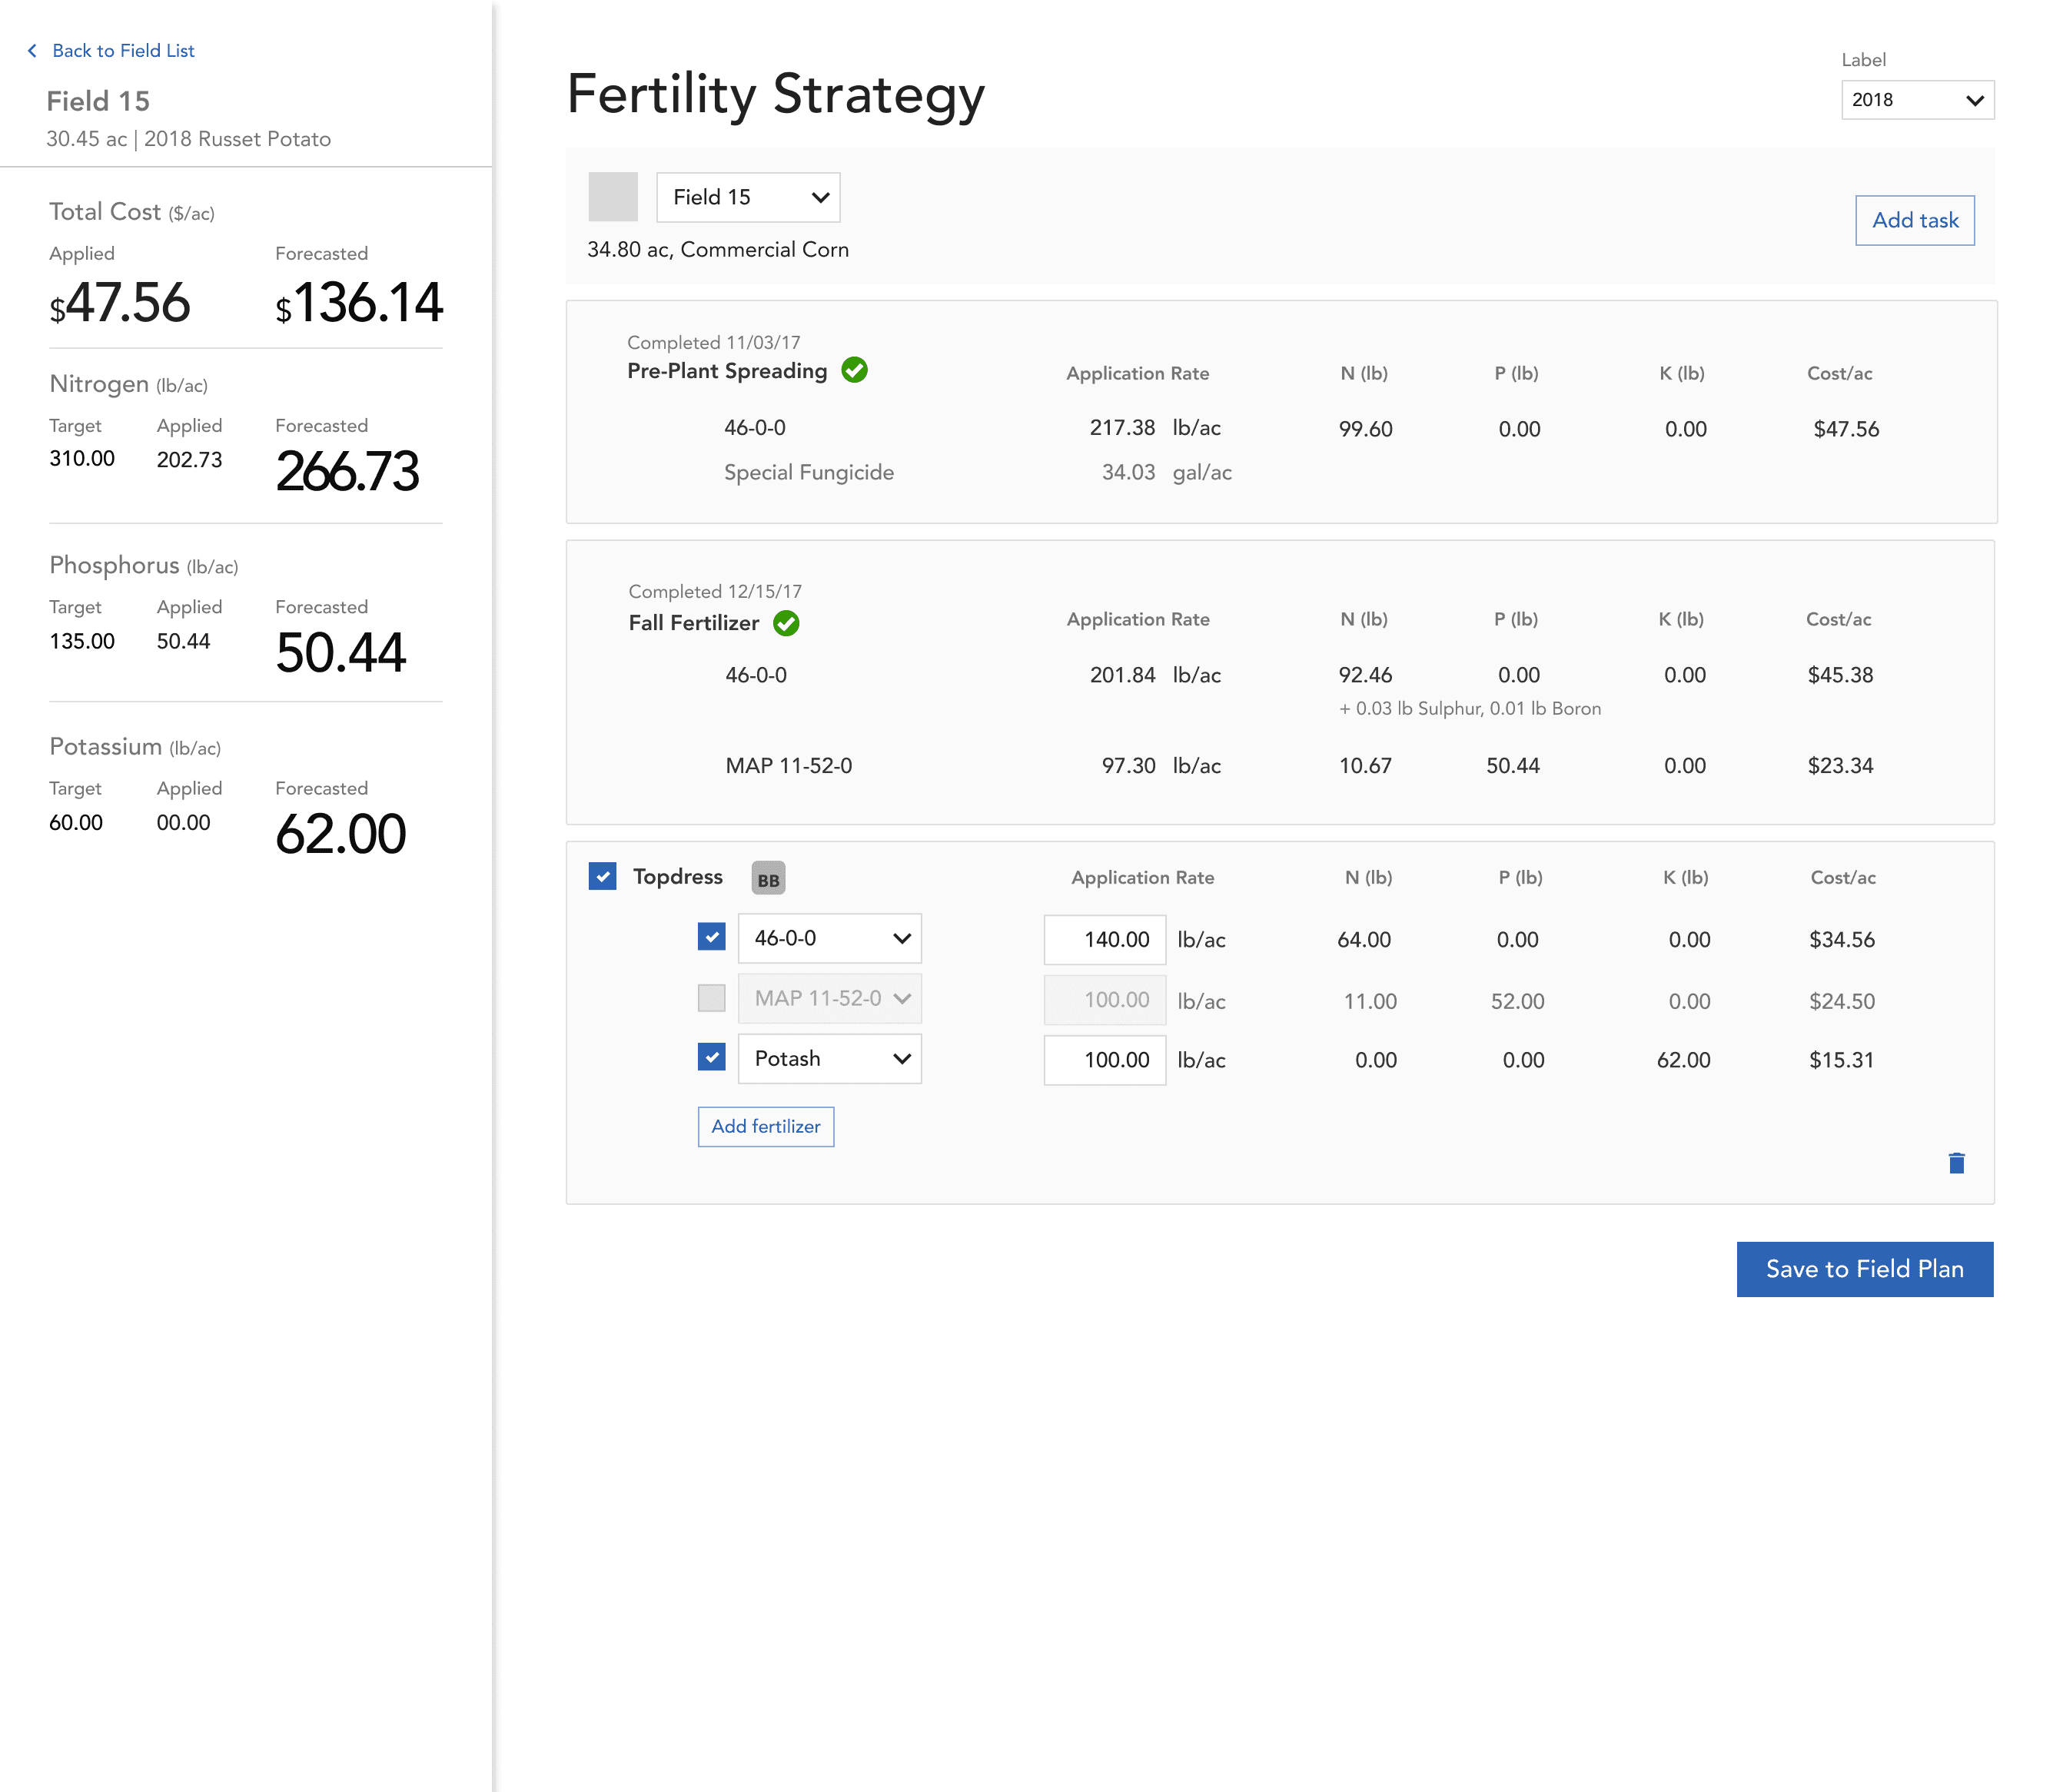
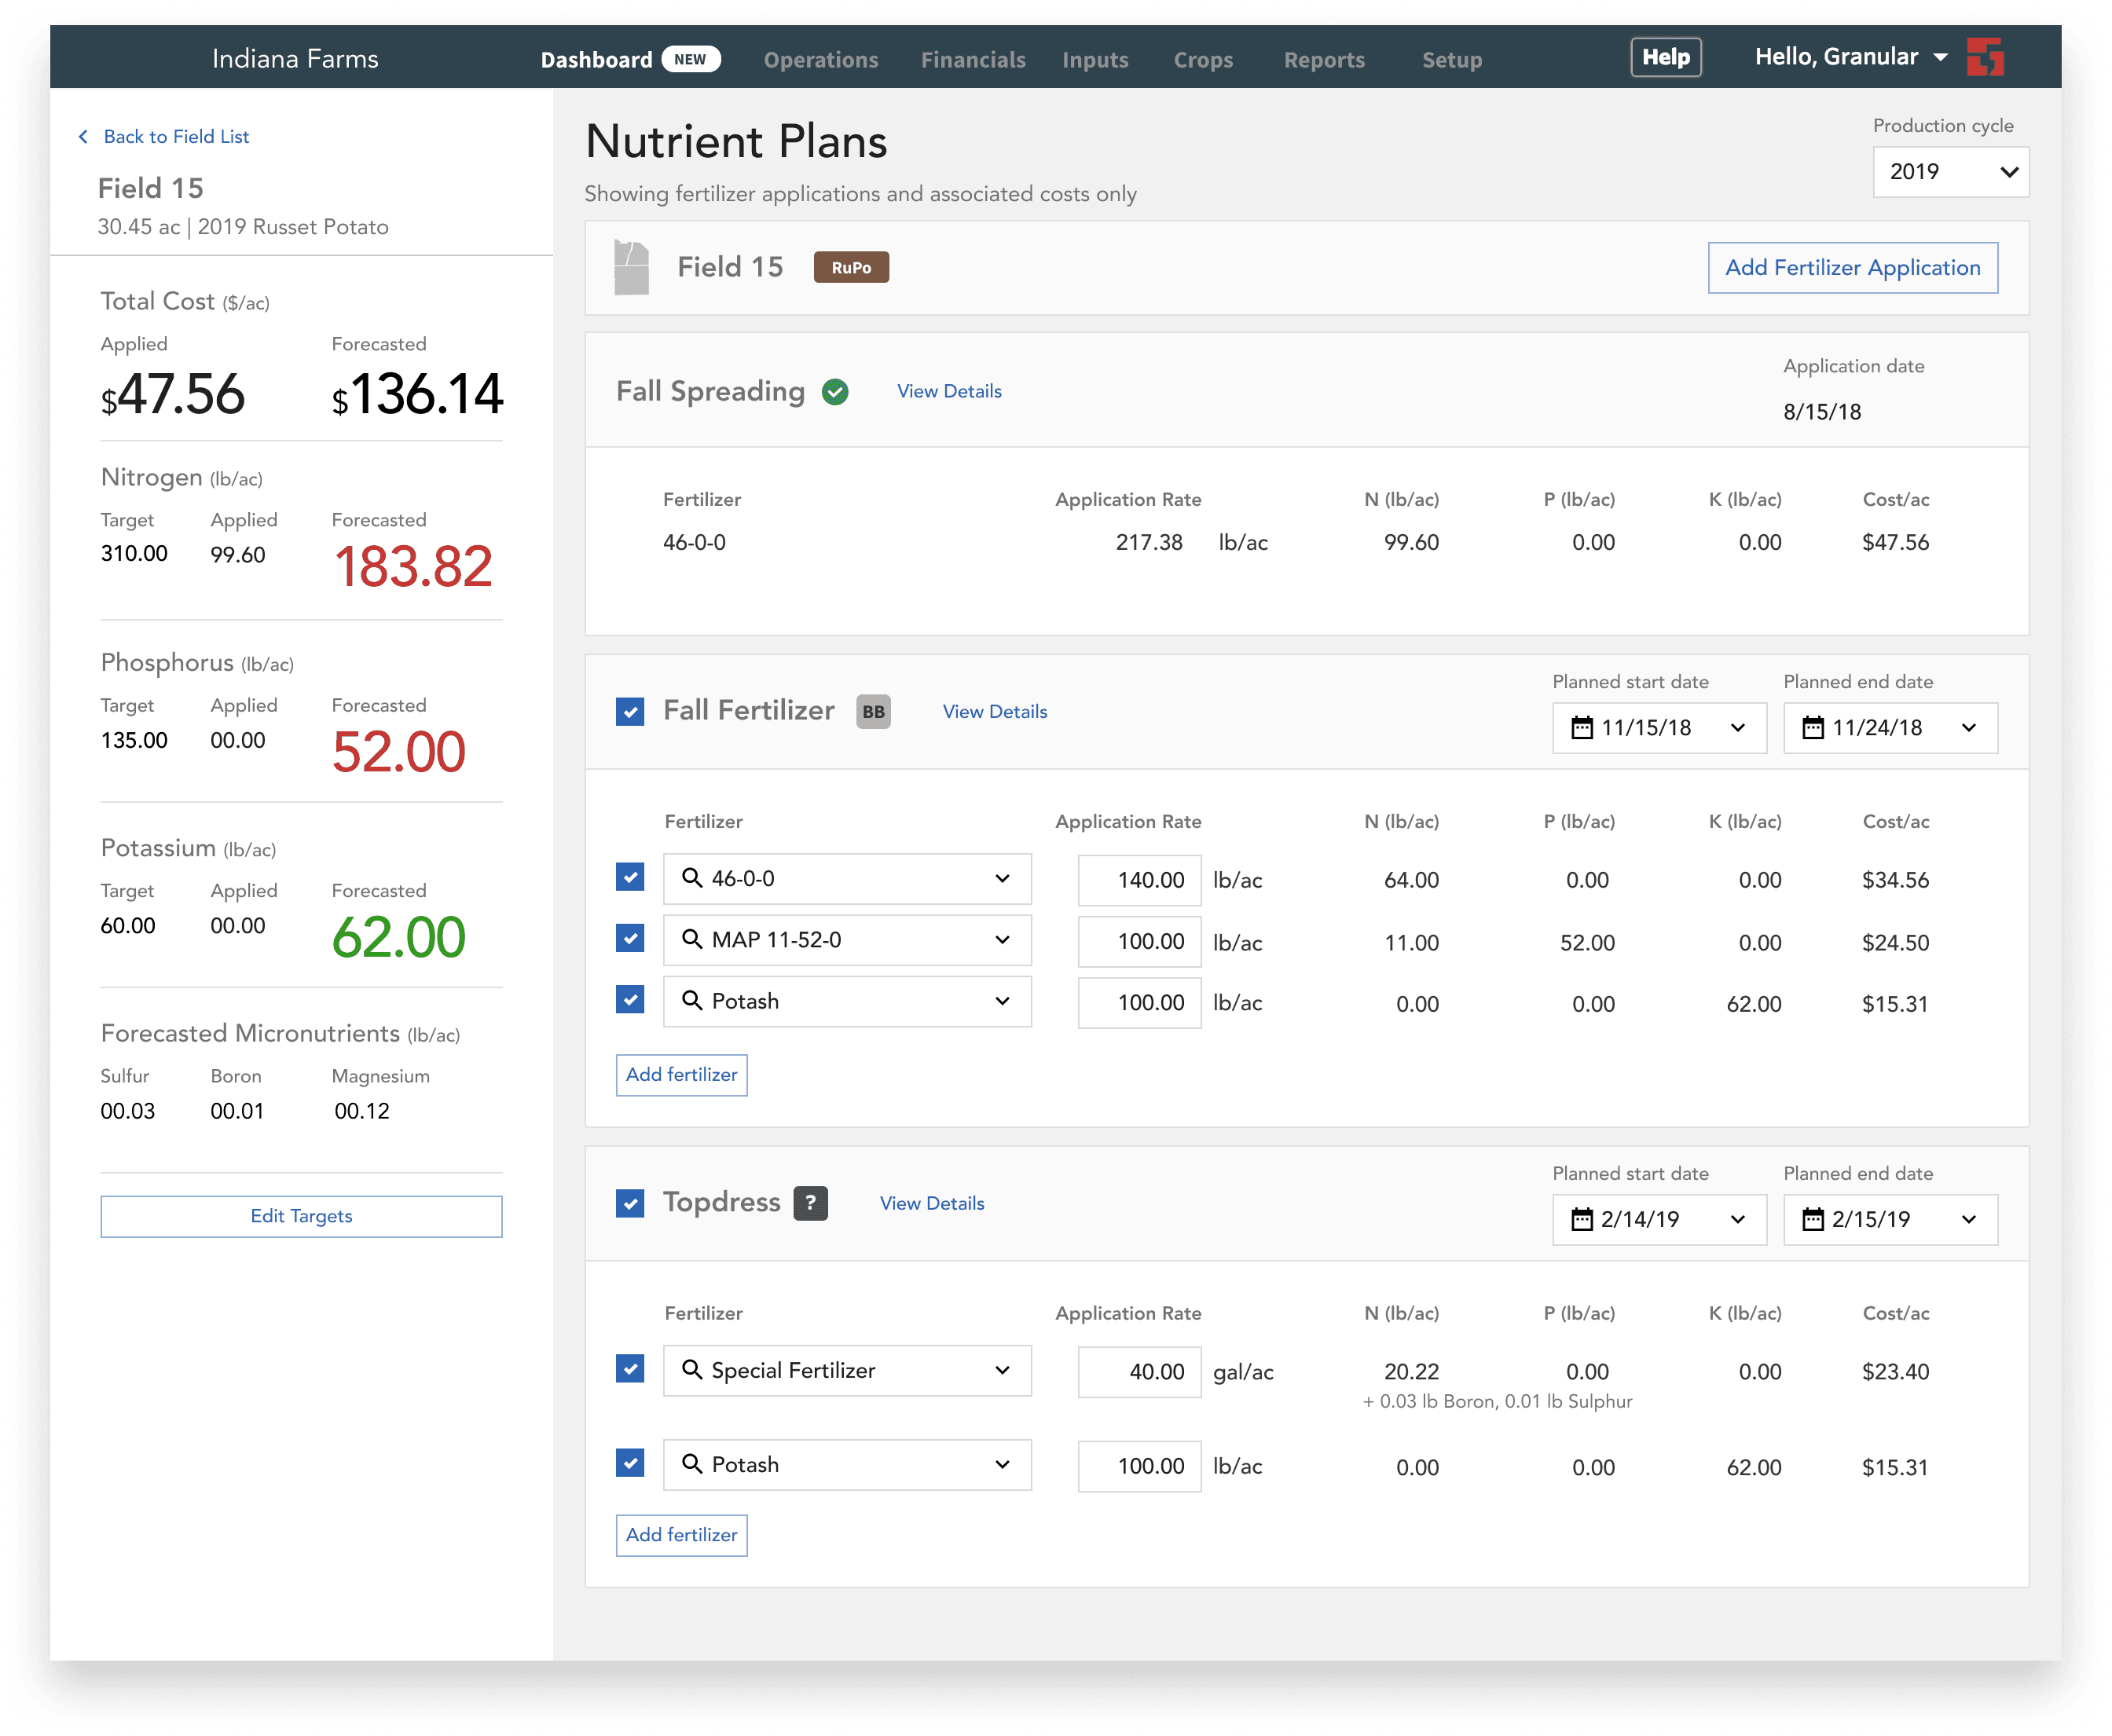
⭐️ Version C: Nutrient values displayed in the left sidebar with clear visual hierarchy—forecasted values prominently displayed in large text, with target, applied, and planned shown as supporting context. This approach directed attention to the most important number for decision-making while keeping other values accessible.
What I decided: Center around 'Forecasted' values: the combination of nutrients already applied, plus nutrients planned for future applications. While 'Applied' amounts are necessary for tracking, 'Forecasted' values drive decision-making.
Why it mattered:
Pre-season: When no applications have been recorded yet, 'Forecasted' shows only planned amounts, serving as a scenario planning tool. Farmers can model different fertilizer strategies and see estimated costs per acre before committing.
In-season: As applications are executed and recorded, 'Forecasted' automatically combines actual applications with remaining planned applications. Farmers get a real-time view of "where will I end up if I follow through with my current plan?" — enabling them to course-correct if they're trending over or under targets.
Key Decision 03
Finding the right level of detail.
While NPK (nitrogen-phosphorus-potassium) are the primary nutrients that growers care about, fertilizer products also contain micronutrients such as sulfur, zinc, and iron.
The question: Should we show all nutrients equally? (There could be as many as 13.) Only show NPK? Or create a hierarchy?
We weren't sure whether to include micronutrients. Further research showed that potato growers do care about a handful of them, but they're applied in far smaller amounts than NPK (hence the name) and are less critical for day-to-day planning.
What I decided: Display NPK more prominently, but still make micronutrients accessible.
Why it mattered: This approach respected farmer's mental models (NPK drives most decisions) while maintaining completeness for edge cases.
Top: Nutrient label of a fertilizer product shows NPK and select micronutrient amounts.
Final designs
A scenario planning tool that can be used year-round.
The final solution is a dynamic scenario planning experience that allows farmers to compare forecasted nutrient levels against their agronomic targets in real-time. By prioritizing forecasted amounts—which aggregate both applied fertilizer and future intent—this tool is relevant and useful at all times of the crop cycle.


Launch & Outcomes
Opening the door to the $13M potato market.
The nutrient planning feature launched in June 2019, meeting the critical fall planting window when farmers begin planning next year's applications.
Business impact:
Direct revenue: Projected to contribute $550K in new ACV in 2019
Market entry: Removed primary product blocker for specialty crops, positioned Granular to pursue the $13M potato market
UX impact:
A scalable framework: The system I designed served as a foundation for future active ingredient tracking
Workflow Consolidation: First single page app-type of experience in Granular Business, where a user can do what they need to without going to 5 different pages
Enabled cost analysis and scenario modeling: Farmers can now compare different fertilizer strategies and see projected costs before committing to purchases; moved users from historical tracking to proactive, goal-oriented planning
“This is beneficial to us and will help me keep track of where we are at with our applications. I can look back easily and see what we did last year to know if we can afford another application this year on the same field. I’m the type that likes to plan, and would rather brace the checkbook in advance than look back and wonder why we spent all this money after the fact.”
– Farmer in Wisconsin
“When I showed [potential customer] the example on Field 1 of how it is currently 10lbs of nitrogen over target, and how we can “play” with the next application and reduce it by $3/acre, he said: Yeah, $3-$4/acre does not seem like a lot, but on 1000 acres that really adds up.”
– Granular Sales Representative
“That nutrient plans is a nice addition. It’s nice to see a quick report card of what’s on the field from a nitrogen standpoint, instead of trying to track it through a spreadsheet. ”
– Farmer in Idaho
“Just got off a call with a [competitor] user that is about 6,500 acres. He has looked at us a few times but always felt we were the same as [competitor], just priced higher...well, his tone changed after seeing some of the new functionality we have come out with in 2019. Nutrient Plans was what really caught his attention. While he just renewed last month with [competitor] so he wants to wait the rest of this season out, he wants us to give him a call in winter to talk about changing over.”
– Granular Sales Representative
